Colville Wired Itself
Private carriers would not wire 2,100 square miles of mountains, so the tribe built the network itself. The reservation’s income and employment rose.

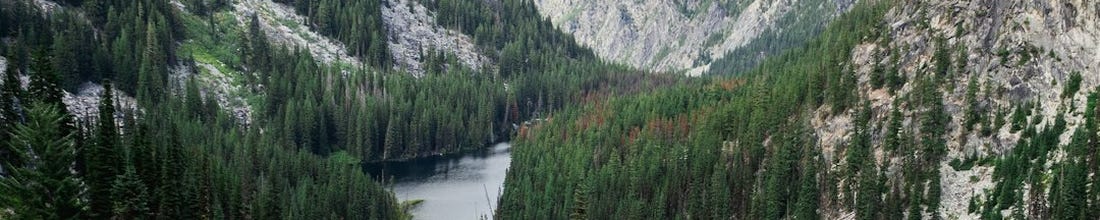
Before 2013, the public offices and schools on the Colville Reservation could not do the everyday online tasks most Americans took for granted. They shared a few T1 lines, an older kind of business connection that carried about 1.5 megabits per second. At that speed, a video call would freeze, a short video would not play, and a large file could take many minutes to send. Major carriers had judged the Colville reservation, 1.4 million acres of rugged country in northeastern Washington, too costly to wire, and they declined to build.
So the tribe wired the reservation itself. To carry a signal across 2,100 square miles of ridgelines, Colville ran fiber-optic cable to three mountain summits and beamed the signal the rest of the way by radio, from one relay to the next and then down to each building. Solar panels and wind turbines powered the relay sites where the electric grid did not reach. In 2013, the first connections reached tribal offices, schools, and community centers at 100 megabits per second, more than sixty times faster than before and fast enough to run video calls, transfer records between offices, and keep dozens of people online at once.1
Prad Sharma and I set out to measure the network’s impact on the reservation’s economy.2 The hard part is that you cannot see what Colville’s economy would have done without the network. So we built a comparison.
We built that comparison from other reservations in Washington, Oregon, Idaho, and Montana, combining them in proportions chosen so that the combination tracked Colville’s income and employment almost exactly through the years before 2013, the years before the network went in. That weighted combination, which we call synthetic Colville, stands in for the Colville that never got the network. After 2013, the real Colville and synthetic Colville pulled apart, and the size of that gap is our estimate of what the network did.3
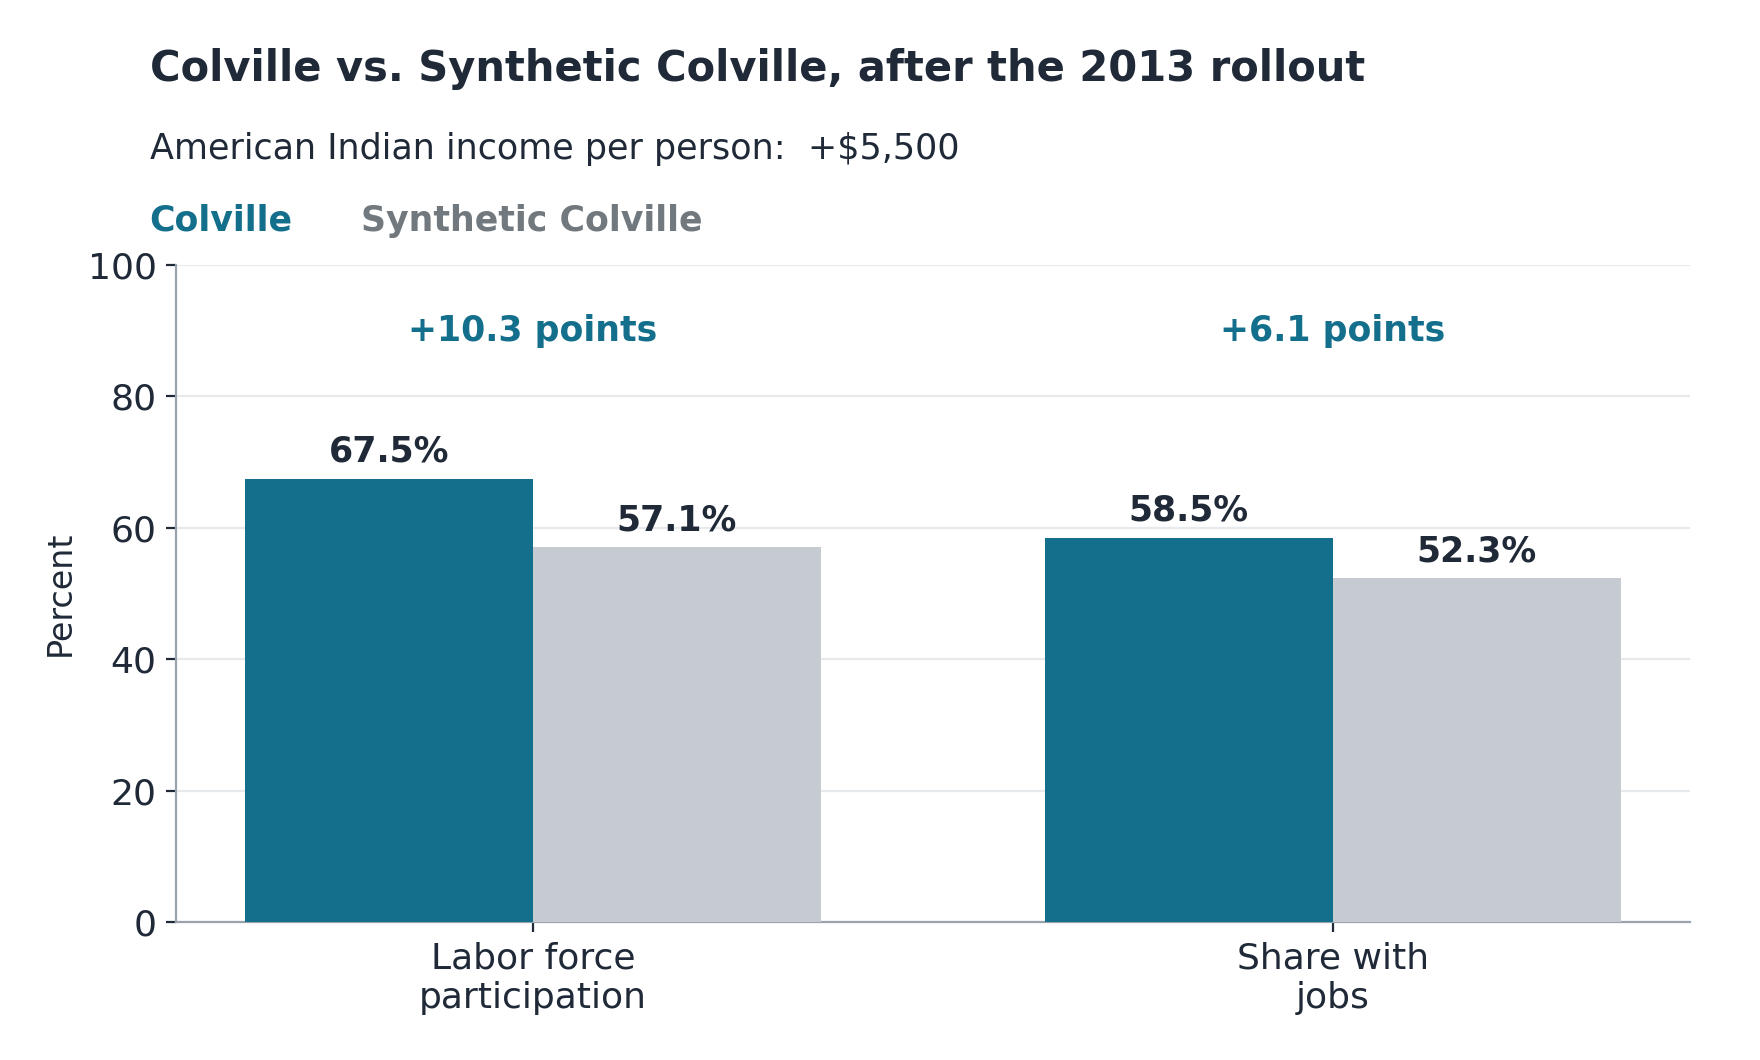
The gap is large. After the network came on, income per person among the reservation’s American Indian residents was about $5,500 higher than in synthetic Colville.4 In the same comparison and over the same period, Colville’s labor force participation rate, the share of working-age adults either working or looking for work, was 10.3 percentage points higher, and the share who actually had jobs was 6.1 points higher.
A second approach points in the same direction. Using annual tax and business records for the reservation’s communities and for nearby areas the network did not reach, we tracked how each area moved after broadband arrived. Income reported per tax return and wages both rose soon after. Paid jobs at local businesses rose too, a little more slowly.5
Where did the gains come from? Not from homes, and not from people moving to the reservation. Very few households ever got their own connection; almost everyone accessed the internet through the reservation’s public buildings. Measured home subscription bears that out, staying flat relative to comparable reservations, and Colville’s population did not grow relative to synthetic Colville.6
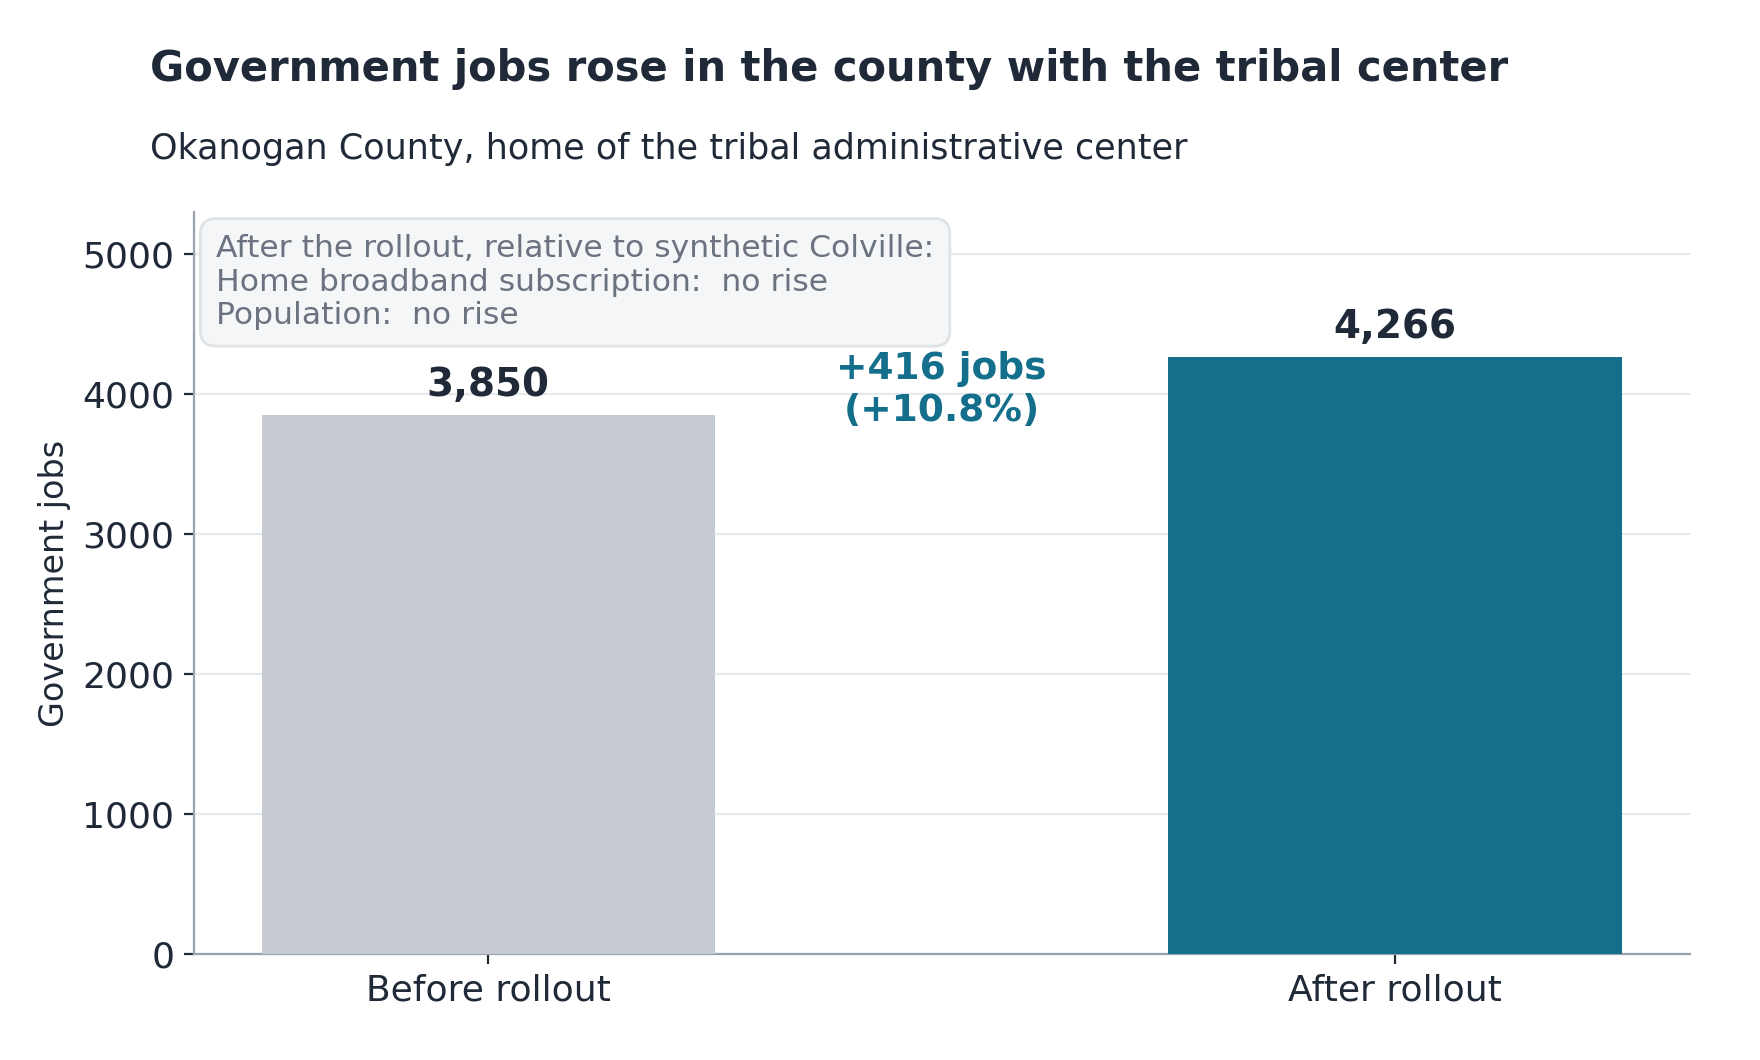
The evidence on where the gains came from points to those same public bodies, whose work is exactly the kind that a fast connection speeds up: coordinating across long distances, moving records, and processing applications. In the county that holds the tribal administrative center, the number of government jobs rose from about 3,850 before the rollout to about 4,266 afterward, an increase of more than 400. In contrast, the neighboring county, which does not hold the administrative center, showed no such change.7 And the share of Colville’s working residents in wage or salaried jobs was higher than in synthetic Colville, a shift away from working for oneself. With business employment rising as well, the gains were not limited to public offices alone.
Building the network cost about $3.5 million. Weigh that against the income gains, even counting those gains cautiously, and the benefits come to several times the cost.8
This is the part worth dwelling on, because it is why Colville matters beyond Colville. The gain is large and real, and it landed where the need was greatest. But that gain required something most places never manage: building the network in the first place.
Colville had the ability to design a network for terrain the carriers had refused, to pay for it, to put relays on mountaintops, to power them with sun and wind, and to put the network to work in its own offices the day it switched on. That ability was never the problem. What stood in the way was everything around the build. To lay cable and cross land, the tribe needed approvals from county, state, and federal authorities, all at once. And the basic economics were against it, the same economics that had driven the carriers off: too few customers spread across too much ground.
Colville got through all of it. In most places, those same obstacles, the stacked approvals and the thin-market math, stop the network from ever being built. The barrier is the obstacle course, not the people running it. This is one tribe, not a general estimate, but it is an unusually clean case. It points in the same direction as the other federal programs I have written about here, one on tribal [forest management](https://rulesandresults.substack.com/p/itara-ten-years-three-tribes) and one on [land leasing](https://rulesandresults.substack.com/p/why-73-of-tribes-cant-use-a-law-designed): what holds reservation economies back is the system around them, not the tribes themselves.
None of this is abstract right now, because there is new money on the table. On June 17, the National Telecommunications and Information Administration (NTIA), the federal agency that runs tribal broadband programs, opened about $790 million in new tribal broadband funding, with applications due September 17.9 That money can pay for equipment and construction. What it cannot do by itself is get past the approvals and the thin-market economics that keep these networks from being built in the first place.
Colville did not wait for any of that to change. When the phone and cable companies would not build across 2,100 square miles of mountains, the tribe secured approvals, ran fiber to the summits, and powered the relays with solar and wind. The same money will buy less than what Colville built wherever those obstacles are left standing.
Jordan K. Lofthouse and James Ronyak document the buildout in “Internet Access and Native American Economic Development,” *Journal of Private Enterprise* 40, no. 1 (2025): 51-83. They describe the reservation’s pre-rollout reliance on T1 lines, the hybrid design of fiber-optic cable feeding wireless links from three mountaintop relay sites (Omak Mountain, Moon Mountain near Nespelem, and Keller Butte), and the off-grid solar and wind systems that powered those sites. The first communities came online in 2013, and the southern relay serving Keller followed in 2014. Ronyak brought this case to our attention and explained the buildout.
Pradyot Sharma and Thomas Stratmann, “[Digital Infrastructure in Thin Markets: Evidence from a Tribal-Led Broadband Rollout](https://papers.ssrn.com/sol3/papers.cfm?abstract_id=7016898),” working paper, 2026.
The reservation-level design is a synthetic control. The comparison is drawn from reservations in Washington, Oregon, Idaho, and Montana with at least 1,000 residents in each pre-rollout year, weighted to match Colville’s pre-2013 income, employment, and related characteristics, including pre-rollout internet availability. Outcomes come from American Community Survey five-year estimates, and the post-rollout window runs from 2018 through 2022, the first endpoint years whose underlying five-year samples fall entirely after the 2013 rollout. Across all three outcomes, Colville’s post-rollout divergence ranks first among placebo runs that assign the same start year to each comparison reservation, with a permutation p-value of 0.042. Dollar figures are in 2016 dollars.
The income gap is 0.31 log points, about $5,500 in 2016 dollars, averaged over the 2018 to 2022 post-rollout window. An [earlier post on this Substack](https://rulesandresults.substack.com/p/after-broadband-a-4000-lift-in-per) reported a preliminary figure of roughly $4,000; the estimate here reflects the completed analysis.
The annual design is a staggered difference-in-differences estimator using Internal Revenue Service Statistics of Income data and Census Bureau County Business Patterns data for ZIP code areas covering both the reservation’s communities and nearby areas that the network did not reach. Adjusted gross income per return rose about 6.6 percent, wages per return about 9.7 percent, and paid employment at establishments about 12.9 percent. Because ZIP areas extend beyond reservation boundaries, these annual estimates complement the reservation-level results rather than serving as the main estimate.
According to the network’s operators, the buildout served the reservation’s public institutions, and only a small number of households received their own receiving equipment. Consistent with this, measured household broadband subscriptions on Colville were below the comparison reservations from 2017, the first year the survey reports them, through 2022. The total population was essentially unchanged relative to synthetic Colville. Both patterns weigh against home subscription and in-migration as the main channels.
Public-sector employment is measured using the Census Bureau’s Quarterly Workforce Indicators for counties that overlap the reservation. The rise from about 3,850 to about 4,266 jobs, roughly 10.8 percent, is in Okanogan County, which contains the tribal administrative center at Nespelem; Ferry County, which also overlaps the reservation, shows no comparable change. The pooled county-quarter estimate is positive but not statistically significant, so the interpretation rests on this cross-county pattern and the rollout sequence rather than on a single coefficient. The measure captures public employment in general, not tribal-government jobs alone. Over the same period, a larger share of working residents held wage or salaried jobs than in synthetic Colville; equivalently, the self-employment share was lower (0.051 versus 0.110, permutation p-value 0.125), consistent with a shift toward wage-and-salary work.
Documented buildout funding was about $3.5 million, treated as an upfront cost in 2013, with operating costs set at a benchmark of $200,000 a year. The initial construction was supported by a U.S. Department of Agriculture Community Connect grant and a tribal contribution, and the tribe later funded additional expansion. The benefits counted here are the income gains only; the participation and employment gains are not assigned a dollar value. At a 5 percent discount rate, the benefit-cost ratio is about 3 for the horizon ending in 2018 and about 15 for the horizon ending in 2022, with net present values of roughly $9 million and $70 million, respectively. This is an accounting comparison, not a full welfare analysis, and it omits non-income benefits such as school connectivity and telehealth.
The Tribal Broadband Connectivity Program’s third round opened on June 17, 2026, and the Native Entities Grant Program, the Digital Equity Act set-aside for Native entities, opened as a companion notice the same week. Applications for both are due September 17, 2026, and awards are expected on a rolling basis beginning in spring 2027. The available funding is up to $540 million in this third, and likely final, round of the Tribal Broadband Connectivity Program, and at least $250 million through the Native Entities Grant Program, for a total of about $790 million.